
Topology views
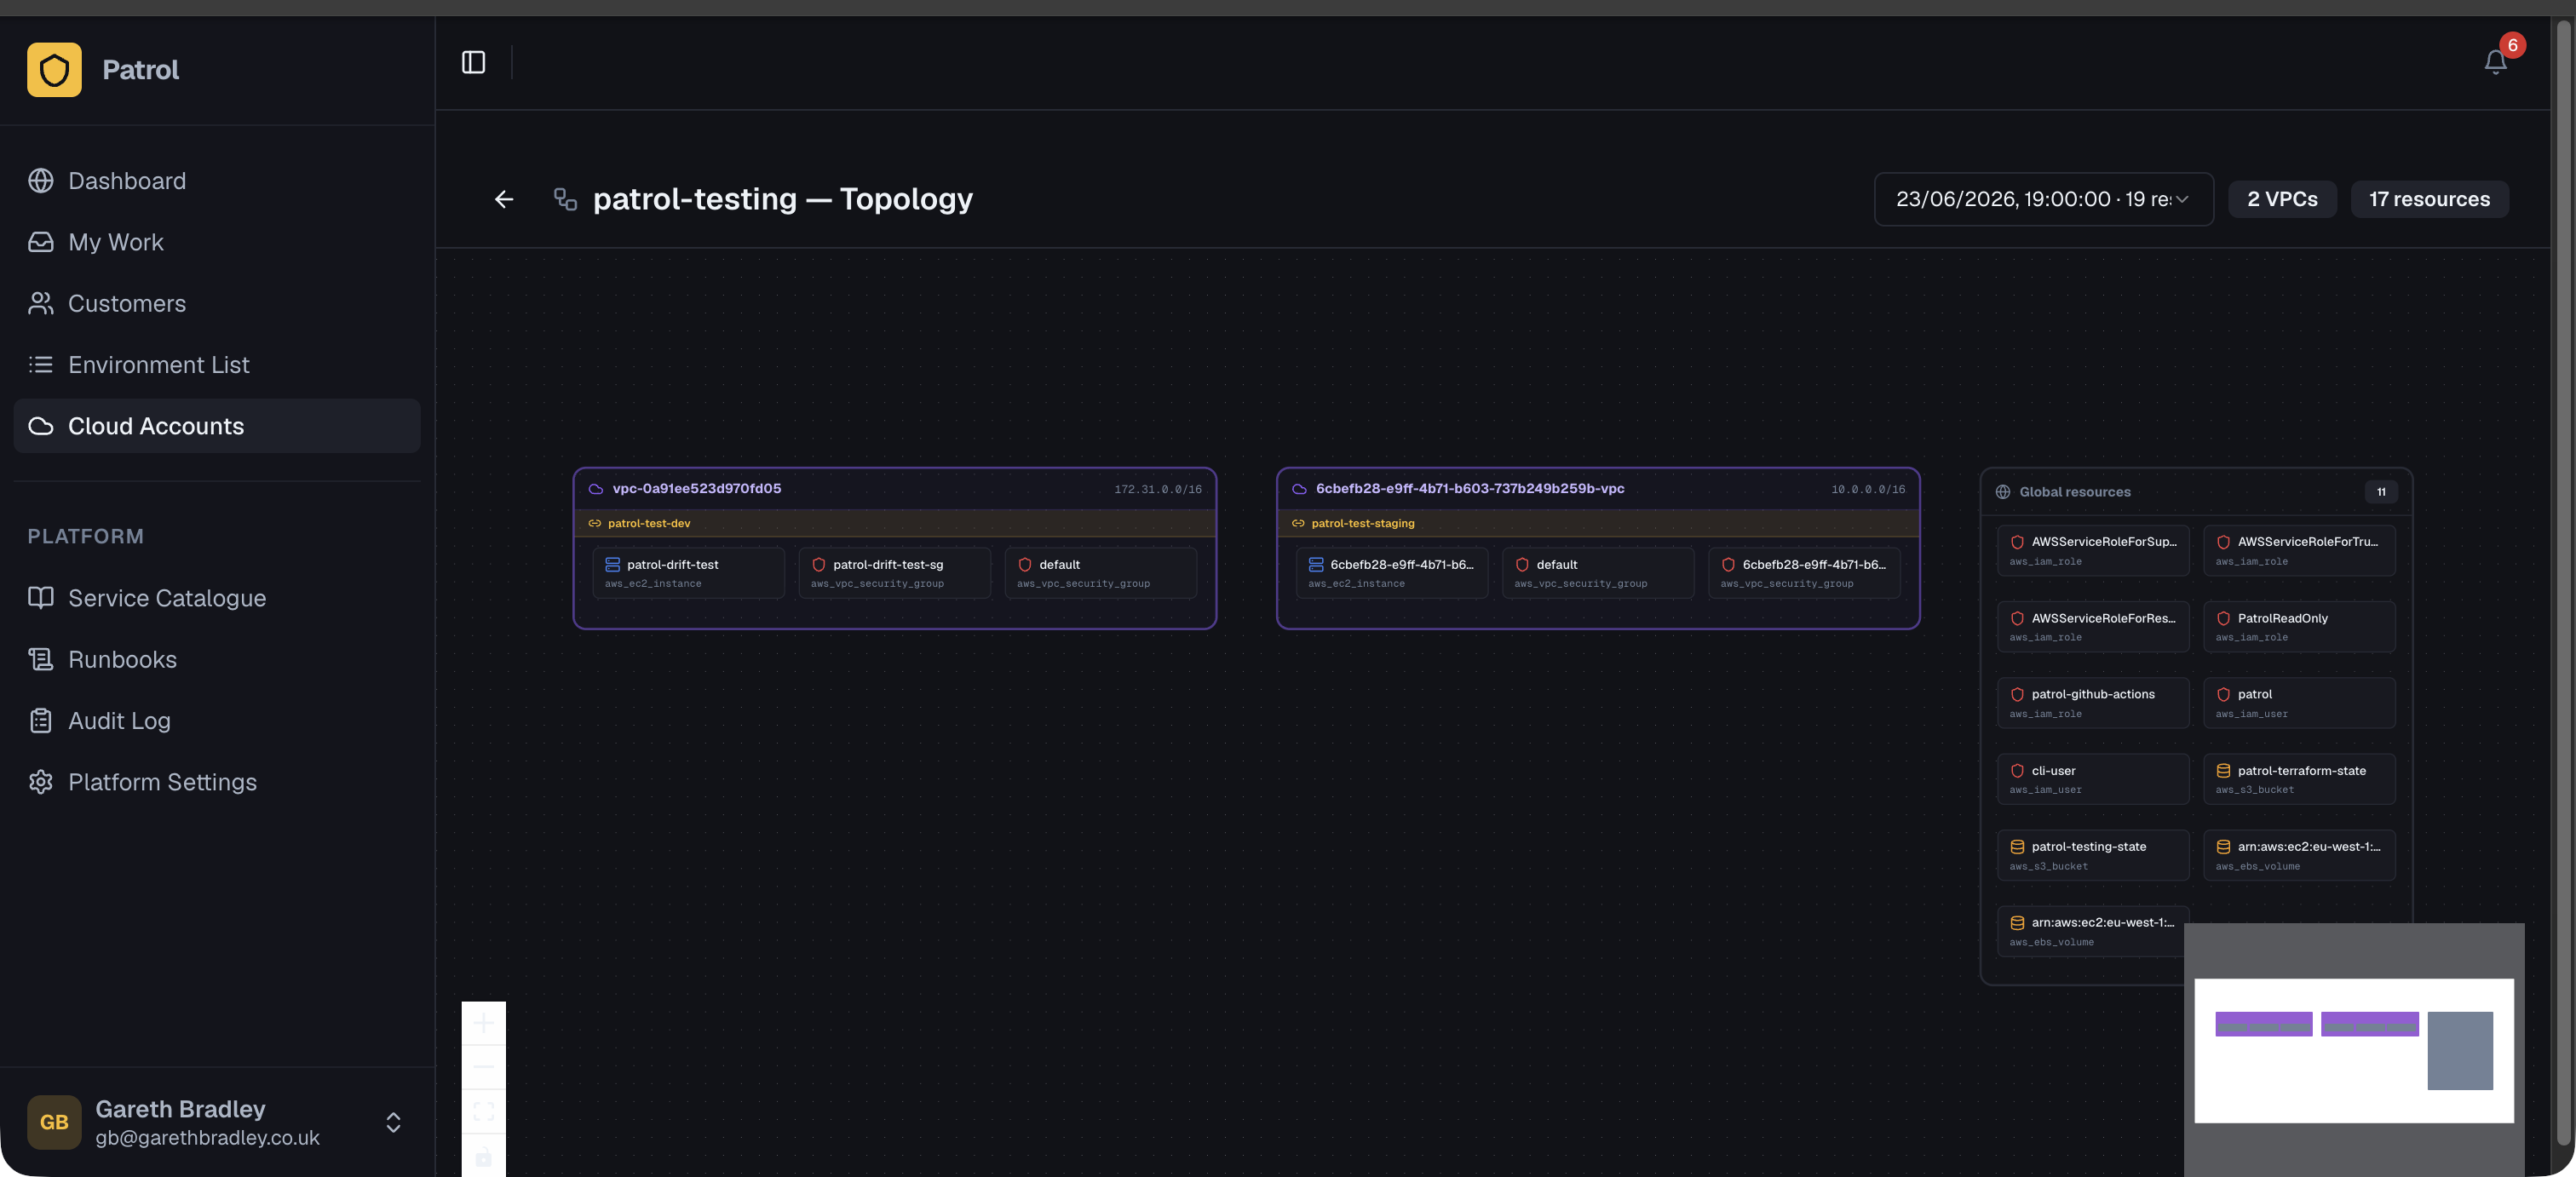
The topology view renders the resources in a snapshot as an interactive graph — VPCs and resource groups at the top level, subnets nested inside them, and individual resources grouped by type within each subnet.
Opening a topology view
Section titled “Opening a topology view”From a cloud account
Section titled “From a cloud account”- Open Cloud Accounts and select an account.
- Click the Topology tab.
This shows the topology for the account’s most recent snapshot.
From a specific snapshot
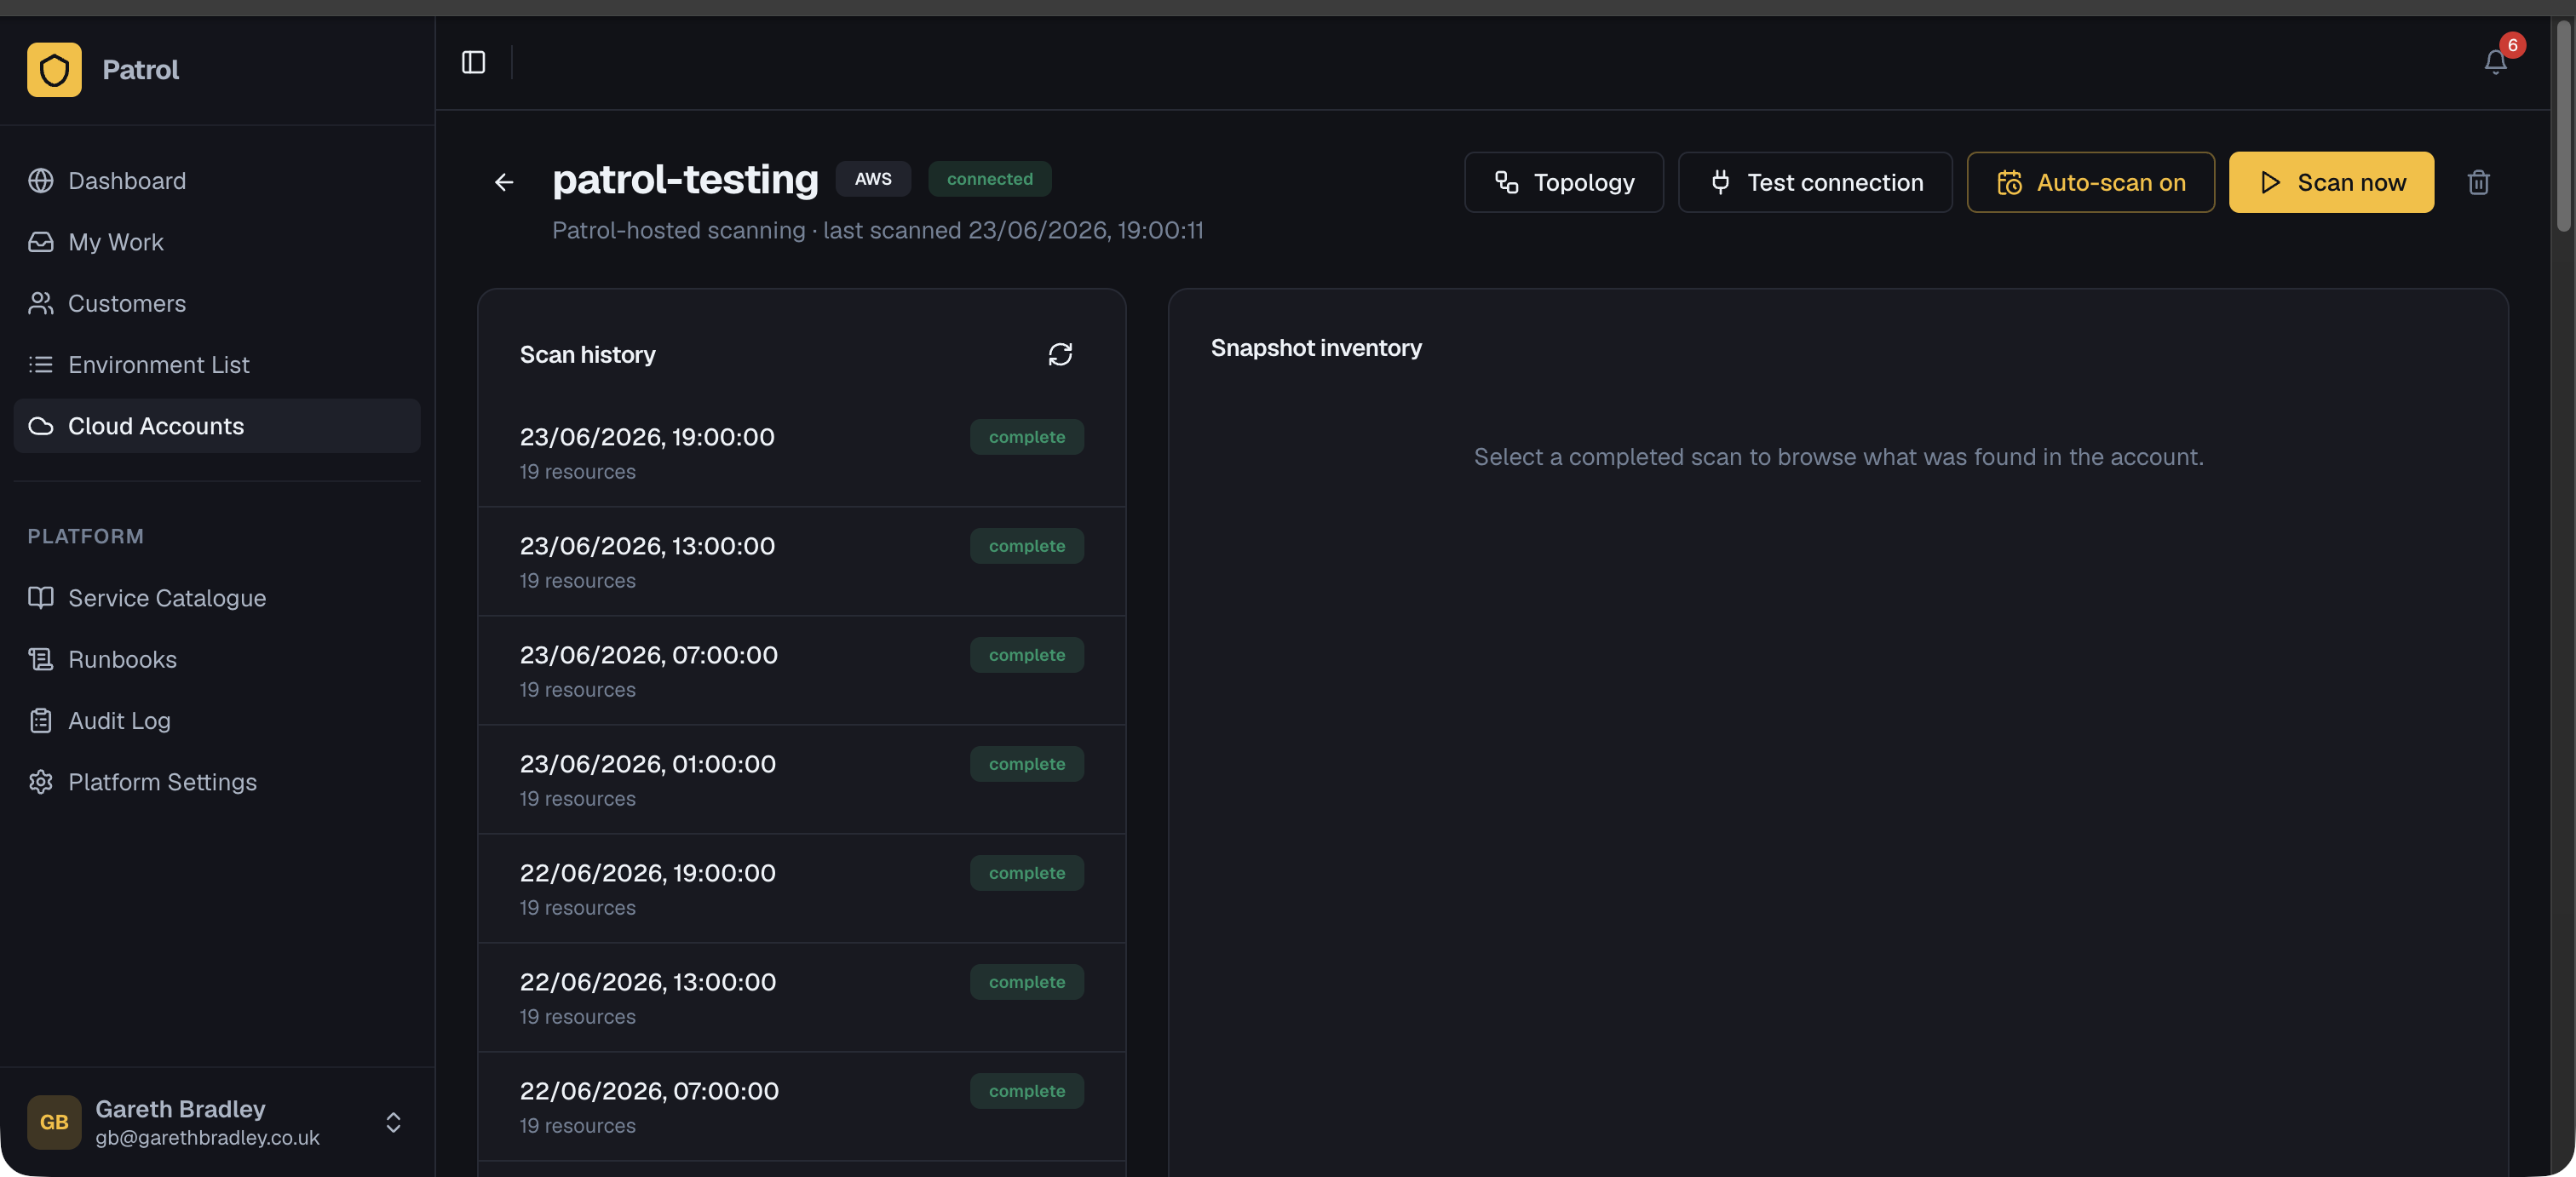
Section titled “From a specific snapshot”- Open a cloud account and go to Scan history.
- Click a snapshot to open it.
- Click View topology.
This lets you compare topologies across scans — useful for seeing how a deployment changed the resource graph.
From an environment
Section titled “From an environment”If an environment has a linked cloud account, its snapshots also support topology:
- Open an environment.
- Go to Snapshots.
- Click a snapshot, then View topology.
Reading the graph
Section titled “Reading the graph”| Element | Description |
|---|---|
| Outer rings | VPCs (AWS) or resource groups (Azure) — top-level network boundaries |
| Inner rings | Subnets nested within a VPC or resource group |
| Nodes | Individual resources (EC2 instances, RDS clusters, security groups, etc.) |
| Edges | Connections between resources (e.g. a load balancer pointing to its target instances) |
| Category colours | Compute, network, IAM, security, storage — each category has a distinct colour |
Hovering over a node shows the resource’s type, ID, region, and key attributes. Resources that don’t belong to a VPC or subnet appear in an ungrouped area at the edge of the graph.
Using topology alongside drift detection
Section titled “Using topology alongside drift detection”The topology view is a snapshot of a point in time. After a deployment, open the new snapshot’s topology and compare it visually to a pre-deployment snapshot to confirm the expected resources appeared (or were removed). For a structured diff, use Drift Detection — the change set shows the same data in tabular form with before/after values.